Today, Tuesday November 3rd is a BIG day in the United States of America. Every four years we elect/re-elect our President. 2020 global and national circumstances have made this year an extra vital election – from all sides. One theme that we hear each campaign cycle is that the electoral college needs to be “fixed”. We started looking for a simple explanation of how it actually works. First we found this 2 page document from the Congressional Research Service: The Electoral College: A 2020 Presidential Election Timeline. Good outline, but 2 long pages of text. Then we found this infographic from USA.gov – a great resource for how our government works!
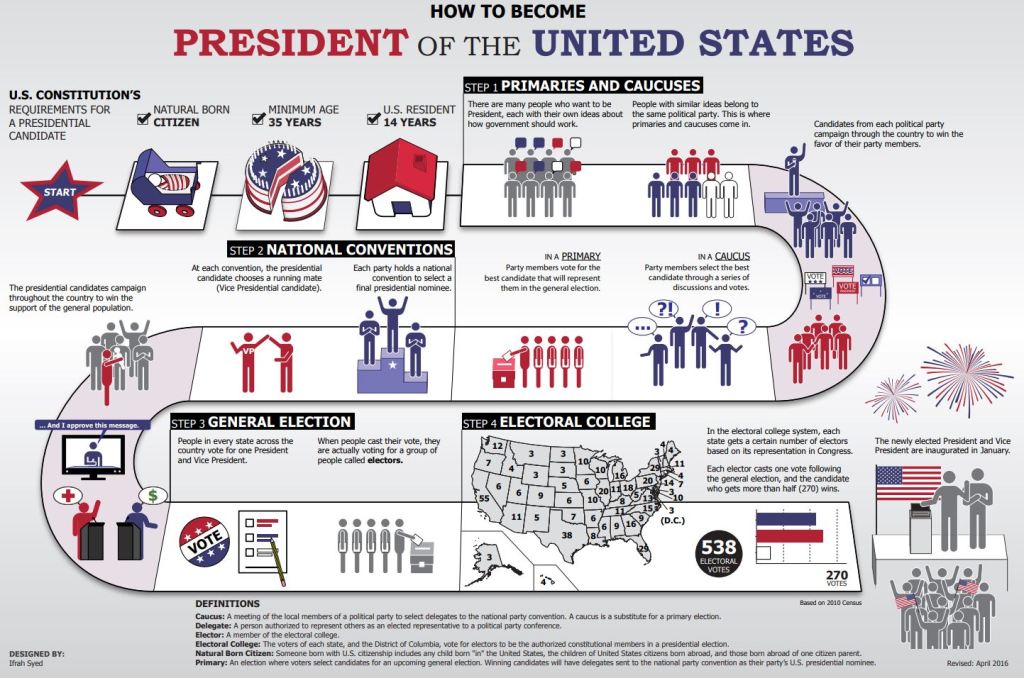
Click on the image to see it in full scale. They also offer a 2:21 video overview – both of these are targeted to educating children to the process!
With a Business Analyst’s eye what is glaringly missing from each of these descriptions is a timeline and a feedback loop for the process.
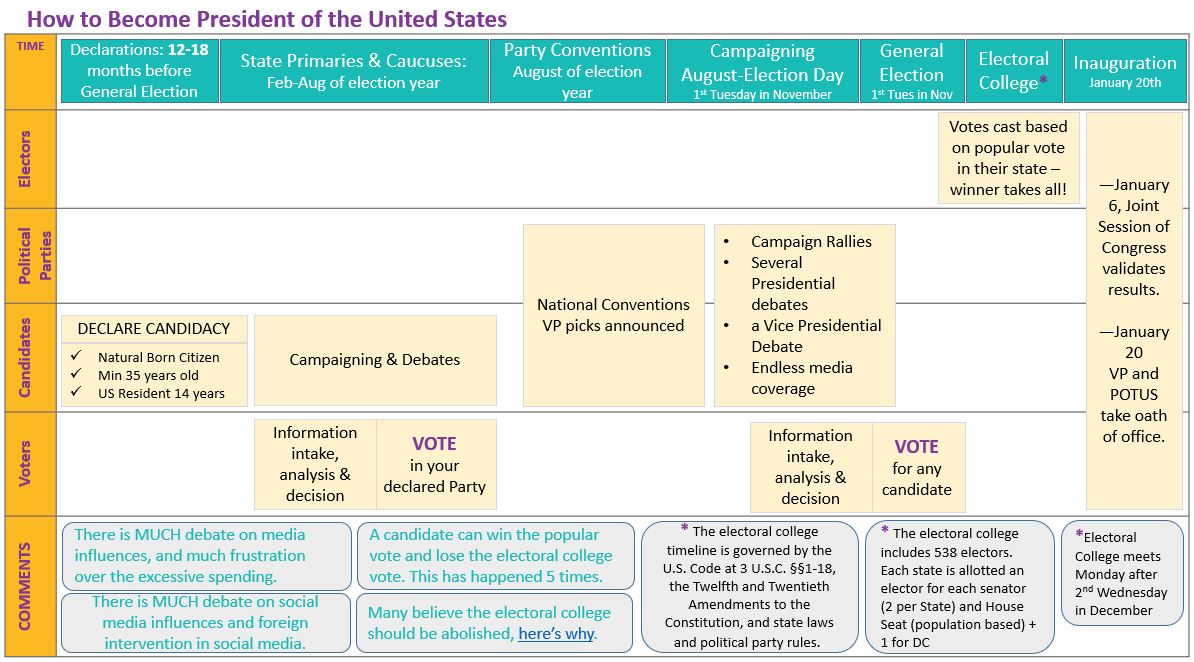
Here is what we call a SMap of how to become POTUS. Click on the image to see it in full scale. SMap is just a cute name for a Swim lane Process Map. There are swim lanes or rows for each stakeholder in the process. The process flows left to right, and the bottom row is reserved for comments to add context and additional information.
Each approach attempts to convey complex information in a visually simple and unbiased way to foster understanding and engagement. One of the advantages of SMaps in an organization is they can provide a standardized approach for communicating processes across the organization. Adding the Process Owner establishes a feedback loop and the inclusion of frequencies and metrics adds critical context for proper prioritization and focus.
Happy Election Day!
